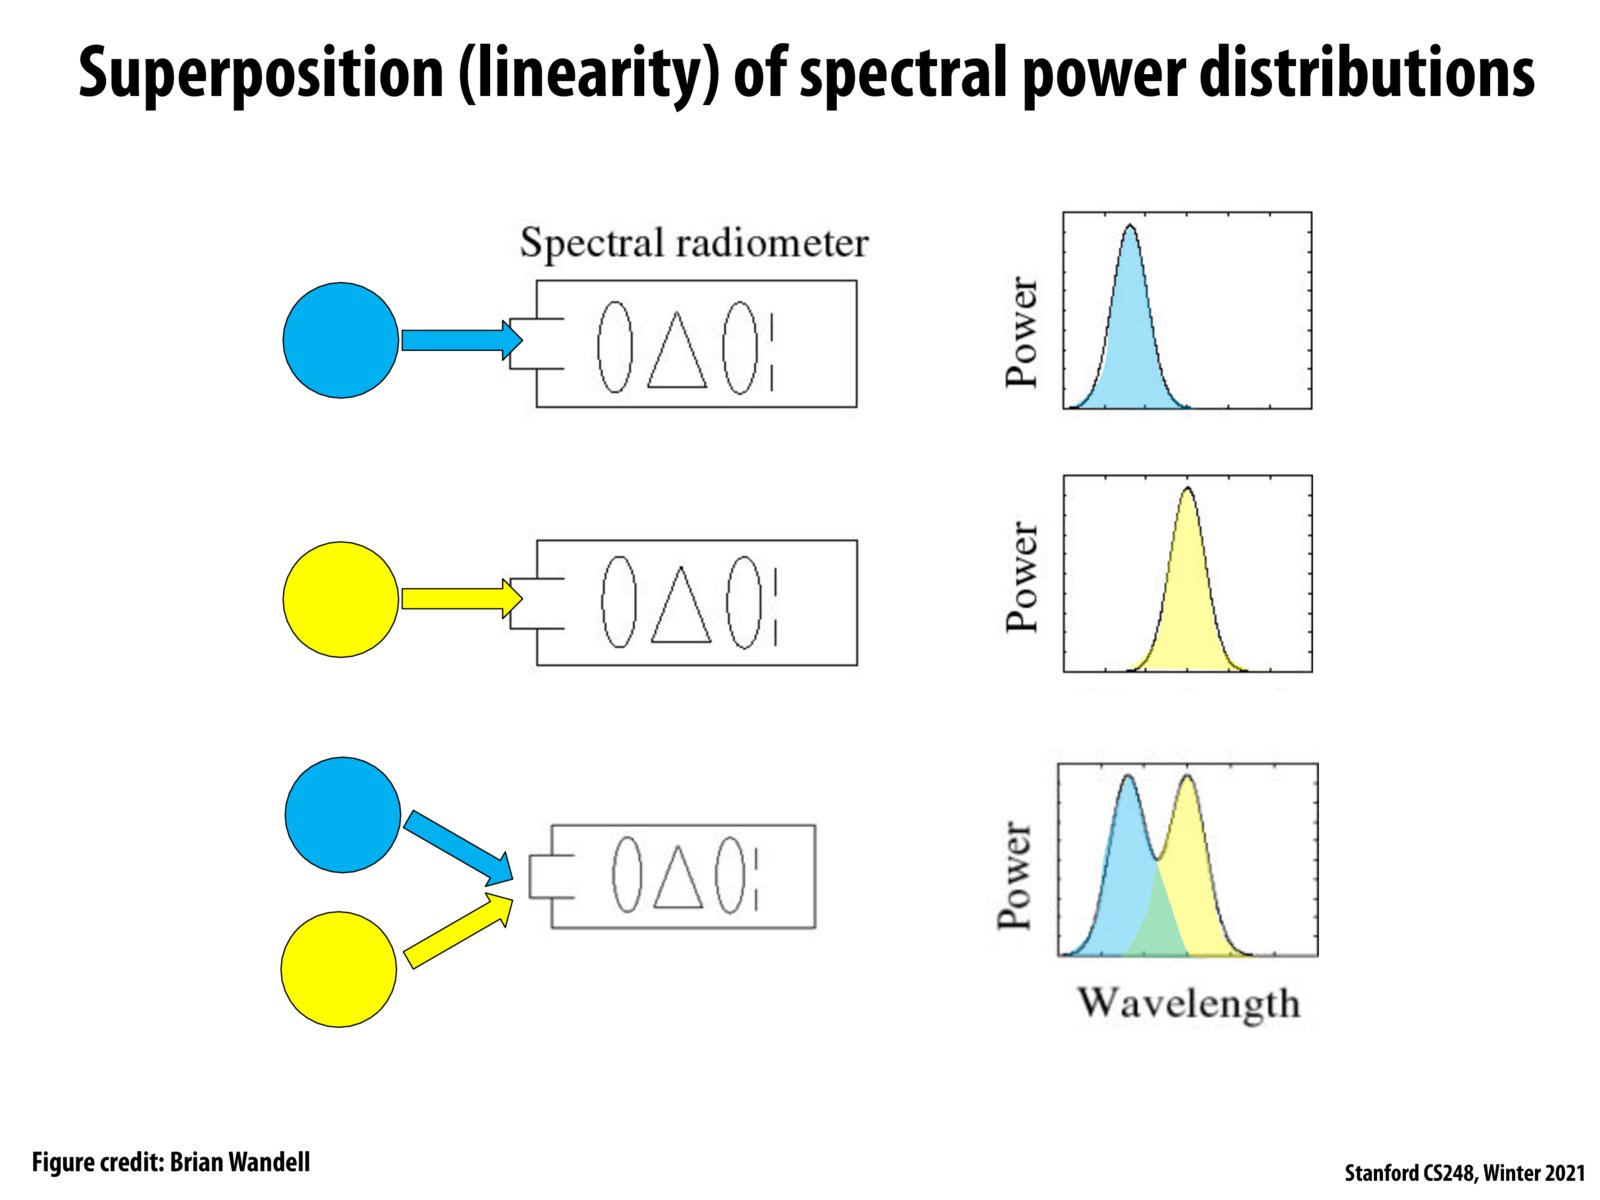
Spectral power distributions of two light sources can be added to get the combined spectral power distribution. However, the bottom graph image looks like a "max" instead of a "sum". Is that image incorrect?
Please log in to leave a comment.
Spectral power distributions of two light sources can be added to get the combined spectral power distribution. However, the bottom graph image looks like a "max" instead of a "sum". Is that image incorrect?