

@jared711 The variables used to describe axes of a 2D Fourier Transform vary by discipline, but in this class, they appear to be described by u and v, with u "corresponding" to the x-axis and v "corresponding" to the y-axis. The "u-axis" corresponds to the frequency content seen as you traverse horizontally across the spatial domain. The "v-axis" corresponds to the frequency content seen as you traverse vertically across the spatial domain. You will see that the value of the spatial domain only varies as you traverse along the x-axis, so naturally we see that the frequency domain only has two dots (technically called impulses that have infinite height and zero width and an area of 1) representing the "bin" of frequency represented horizontally. The image on the right is actually the magnitude of the Fourier Transform; that is, square root of the sum of the square of the real and imaginary parts. What the heck are these imaginary numbers doing here, you may ask? That is a good question. The answer is that the phase of the sinusoid represented in the spatial domain is encoded INTO the phase of the Fourier Transform. For a regular sinusoid sin(x - phi) with phi = 0, i.e., no phase, the left impulse will be entirely in the imaginary domain, and the right impulse will be entirely in the real domain. Introduce a bit of phase and you'll multiply the two terms in the frequency domain by an imaginary exponential, introducing even more imaginary numbers. Generally speaking, a cosine with no phase will have only real terms, and a sine with no phase will have only imaginary terms. Whether a Fourier Transform results in complex values is probably irrelevant for graphics application, though, I'd focus on the magnitude instead.
Tl;dr x-axis -> u-axis in frequency, y-axis -> v-axis in frequency, The Fourier Transform is truly a beautiful transform, the picture on the right is actually the magnitude (sqrt(real^2 + imag^2)) of the Fourier Transform, imaginary and real components correspond to phase of sinusoid

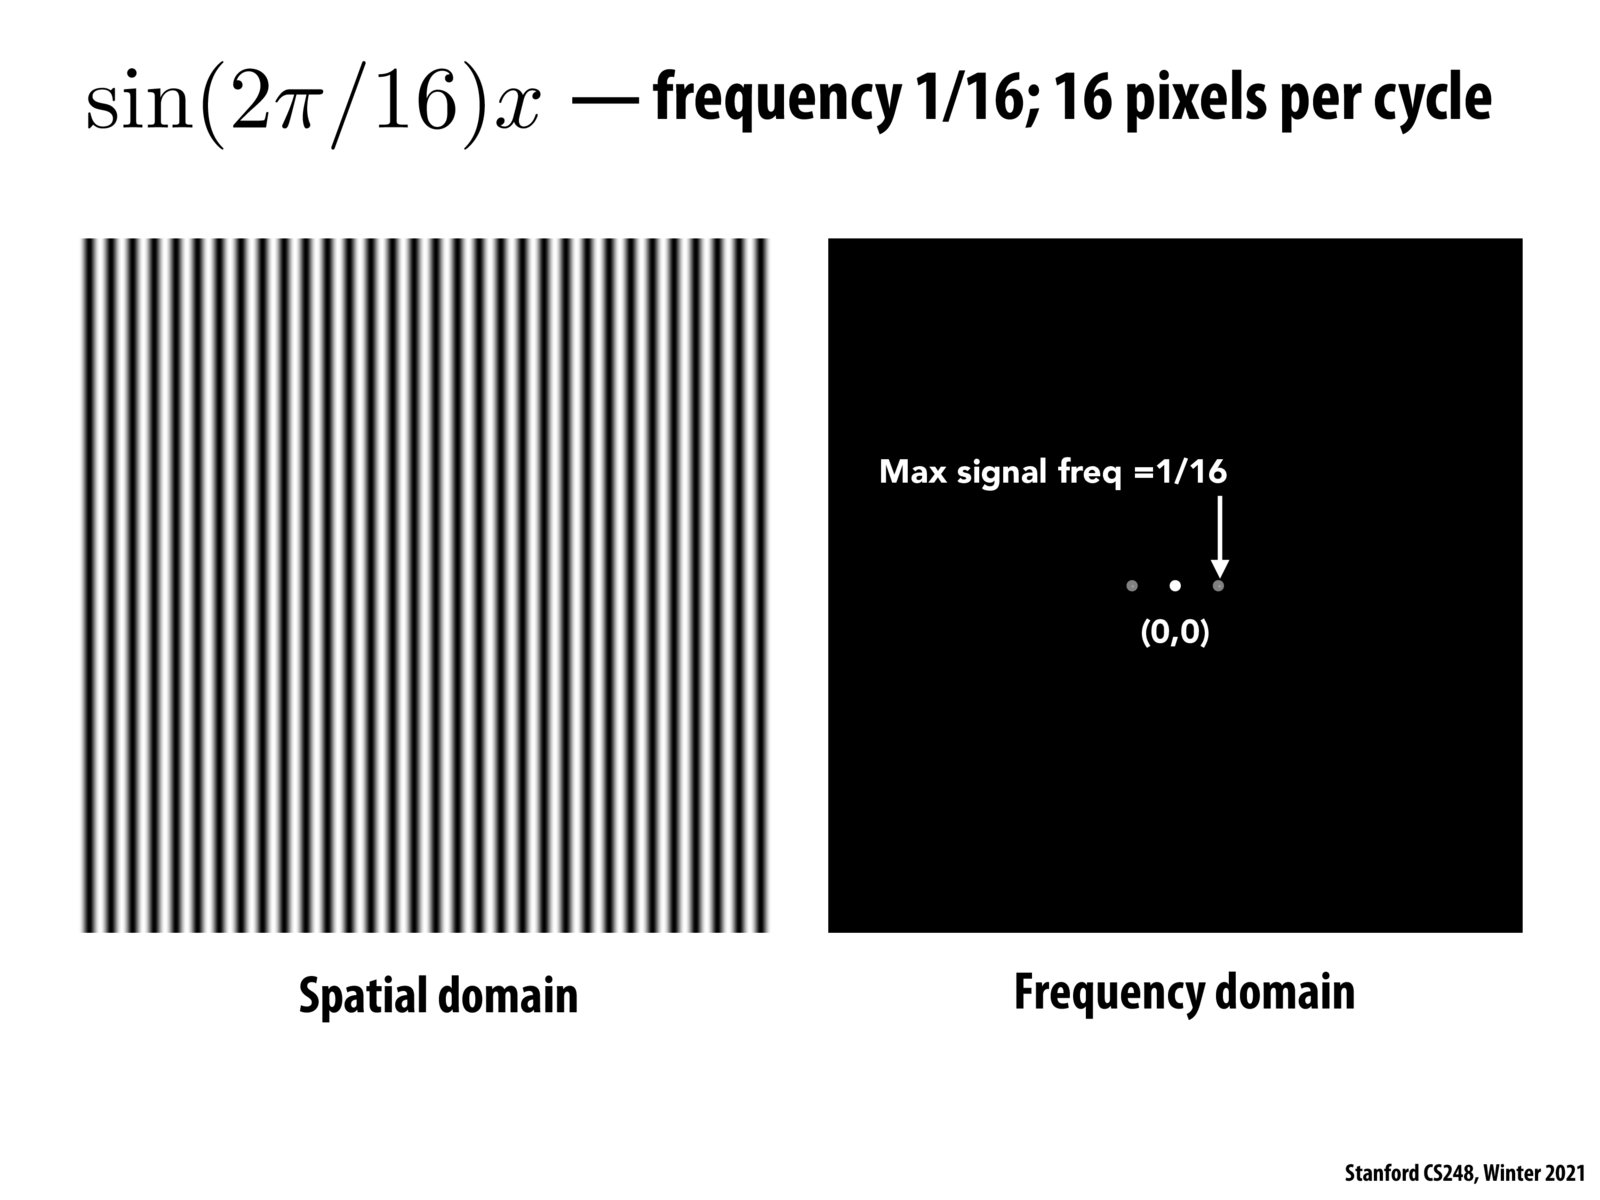
Would it be possible to clarify why higher frequencies move the points in the frequency domain outward from the center?
@jeyla You can think of the very center of the frequency domain as u,v = (0,0), as in "zero frequency." In the EE world, we refer to this value as the DC value, which is a fancy term for the average of all values in the spatial domain. That's because sin(x,y) and cos(x,y) by themselves have an average value of zero, so when we take the Fourier Transform of something, we need to encode the original average value somehow, and we recognize that a uniform value has "zero frequency" as it does not oscillate in any way. Now, assume that the points in the diagram are located at (+1,0) and (-1,0). That corresponds to a sinusoid going left-to-right at, let's just say arbitrarily, 1 "hertz." If the points in the diagram were farther away at say (+5,0) and (-5,0), we would have a sinusoid that oscillates faster at 5 "hertz."

@jeyla Intuitively, Fourier transform decomposes any signal into a combination of different sinusoids with different frequencies. A frequency spectrum (as shown in the image on the right) is a visualization of the transformed signal. In a spectrum of a 1-D signal, the x-axis is the frequency value and the y-axis is the "magnitude" of the sinusoid that has the corresponding frequency value. For example, if your signal is composed of two sinusoids with frequency 1 Hz and 2 Hz: f = sin(2pit) + sin(4pit). Then, after running Fourier transform, its frequency spectrum will have a spike in x=1 and x=2 (and also x=-1 and x=-2 due to the symmetry of sinosoids). Thus, the higher frequency a signal has, the larger "x" is and the more further away it is from the center (x=0). The case for 2D signals is very similar to 1D signals and @jchh has provided a very nice answer to that.
@anthonychen @jchh this was so helpful! Thank you!

@jchh Your answer is so helpful, was really confused during the class. The explanation of relationship between spatial domain and frequency domain is very clear!
Great thread everyone. Good job!
Please log in to leave a comment.
If we were to label the x and y axes of the plot on the right, what would they be? In lecture we talked a little bit about how the left side of the plot is imaginary, but I'm used to seeing imaginary numbers take up one entire axis.