Back to Lecture Thumbnails

cassiez

apappu
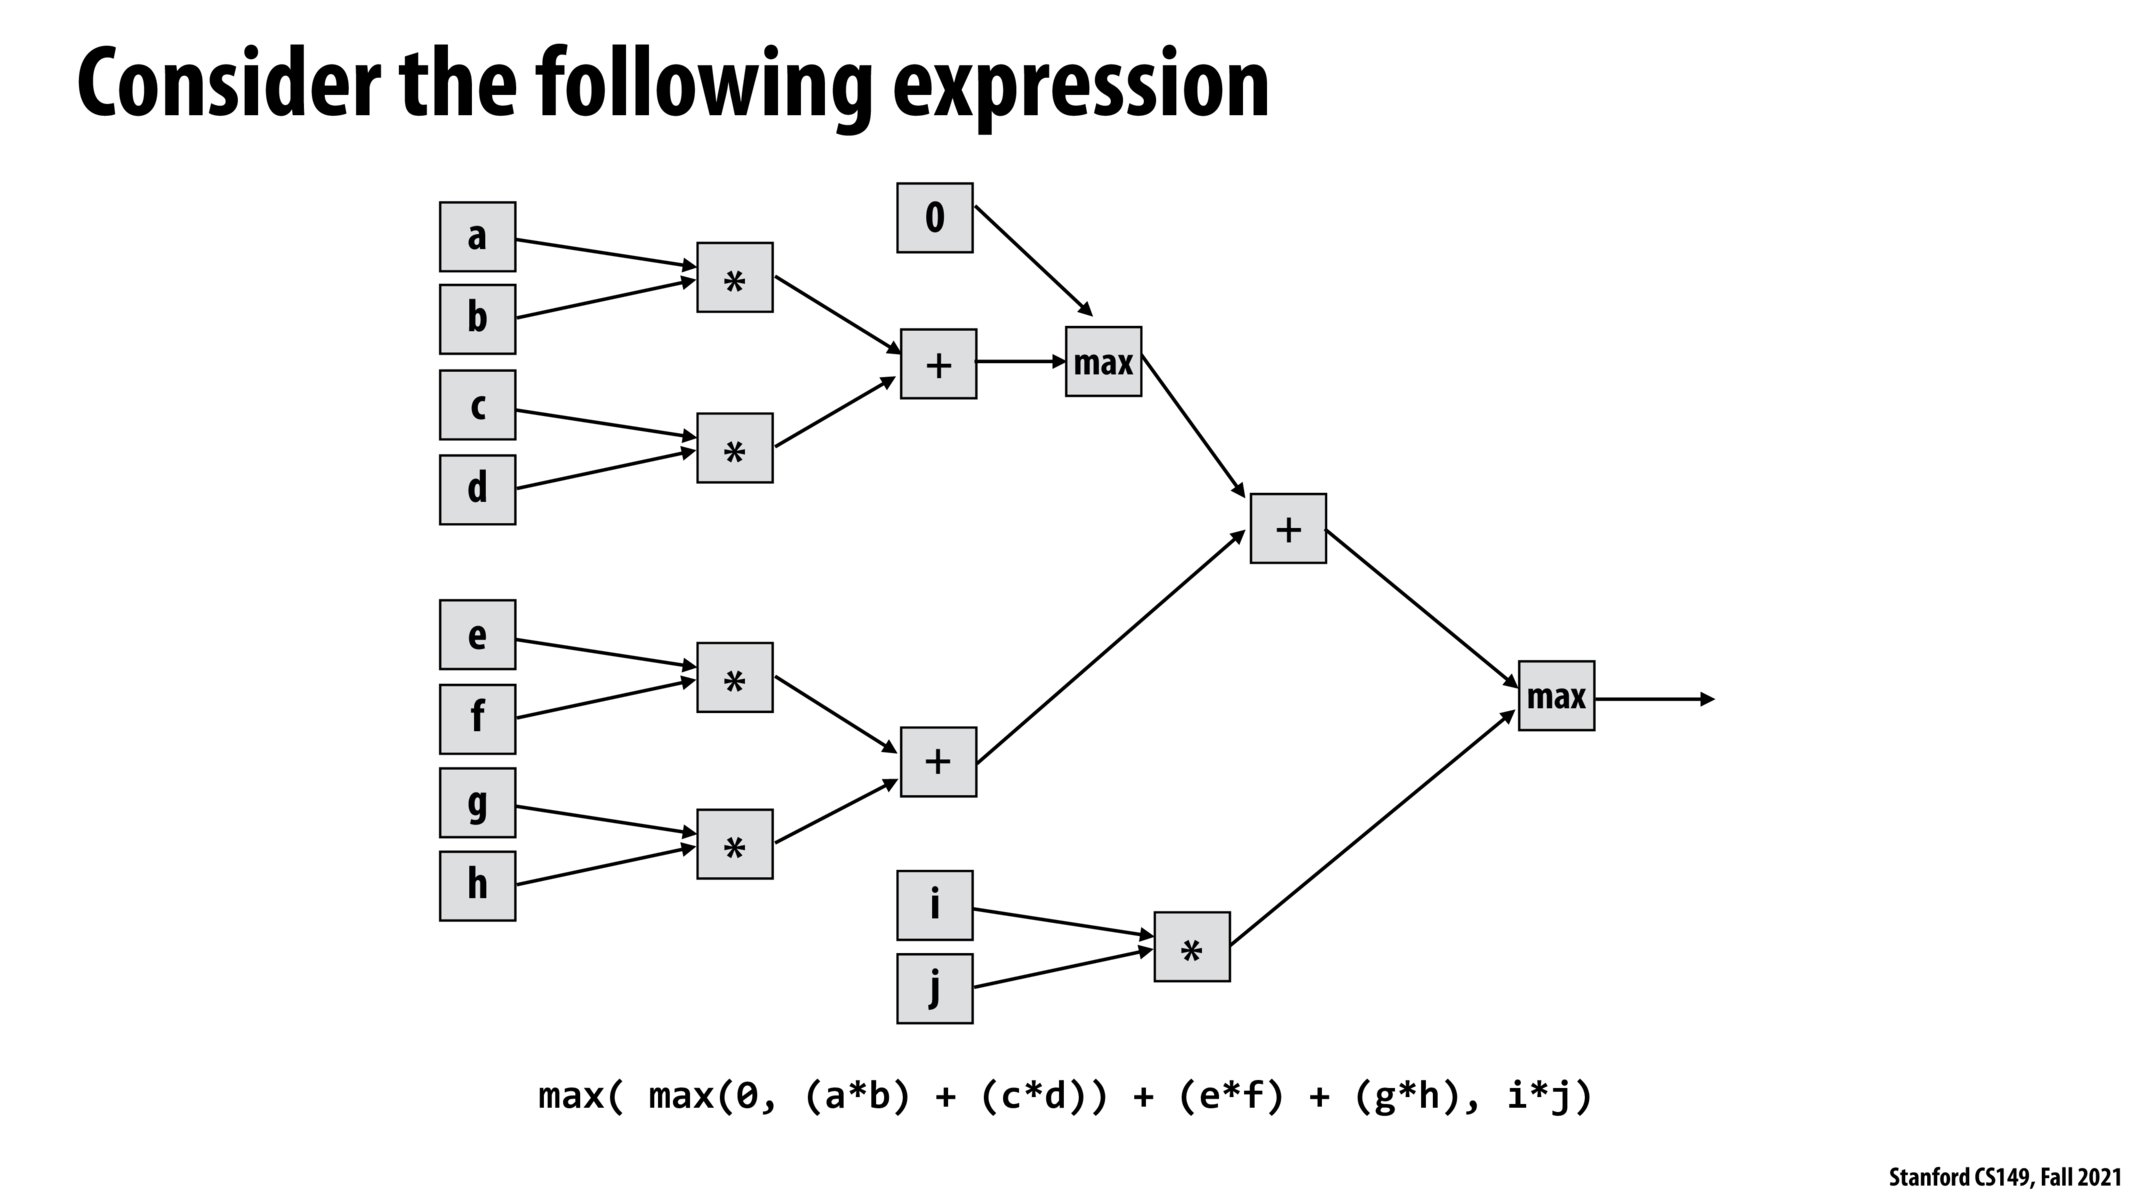
Just adding to above, the computation graph also enables visualizing backpropagation a bit easier (required to train the network's parameters via chain rule on a loss function)
Please log in to leave a comment.
Just some side notes: the graph shown on this slide is sometimes called a "computation graph" in machine learning. When evaluating a neutral network, the data flows from left-hand-side (input a-h) to right-hand-side (output). And to train the neutral network, one could use the backpropagation from RHS to LHS. More about computation graph & backpropagation can be found in this CS221 slide: https://stanford-cs221.github.io/autumn2020-extra/modules/machine-learning/backpropagation.pdf :)