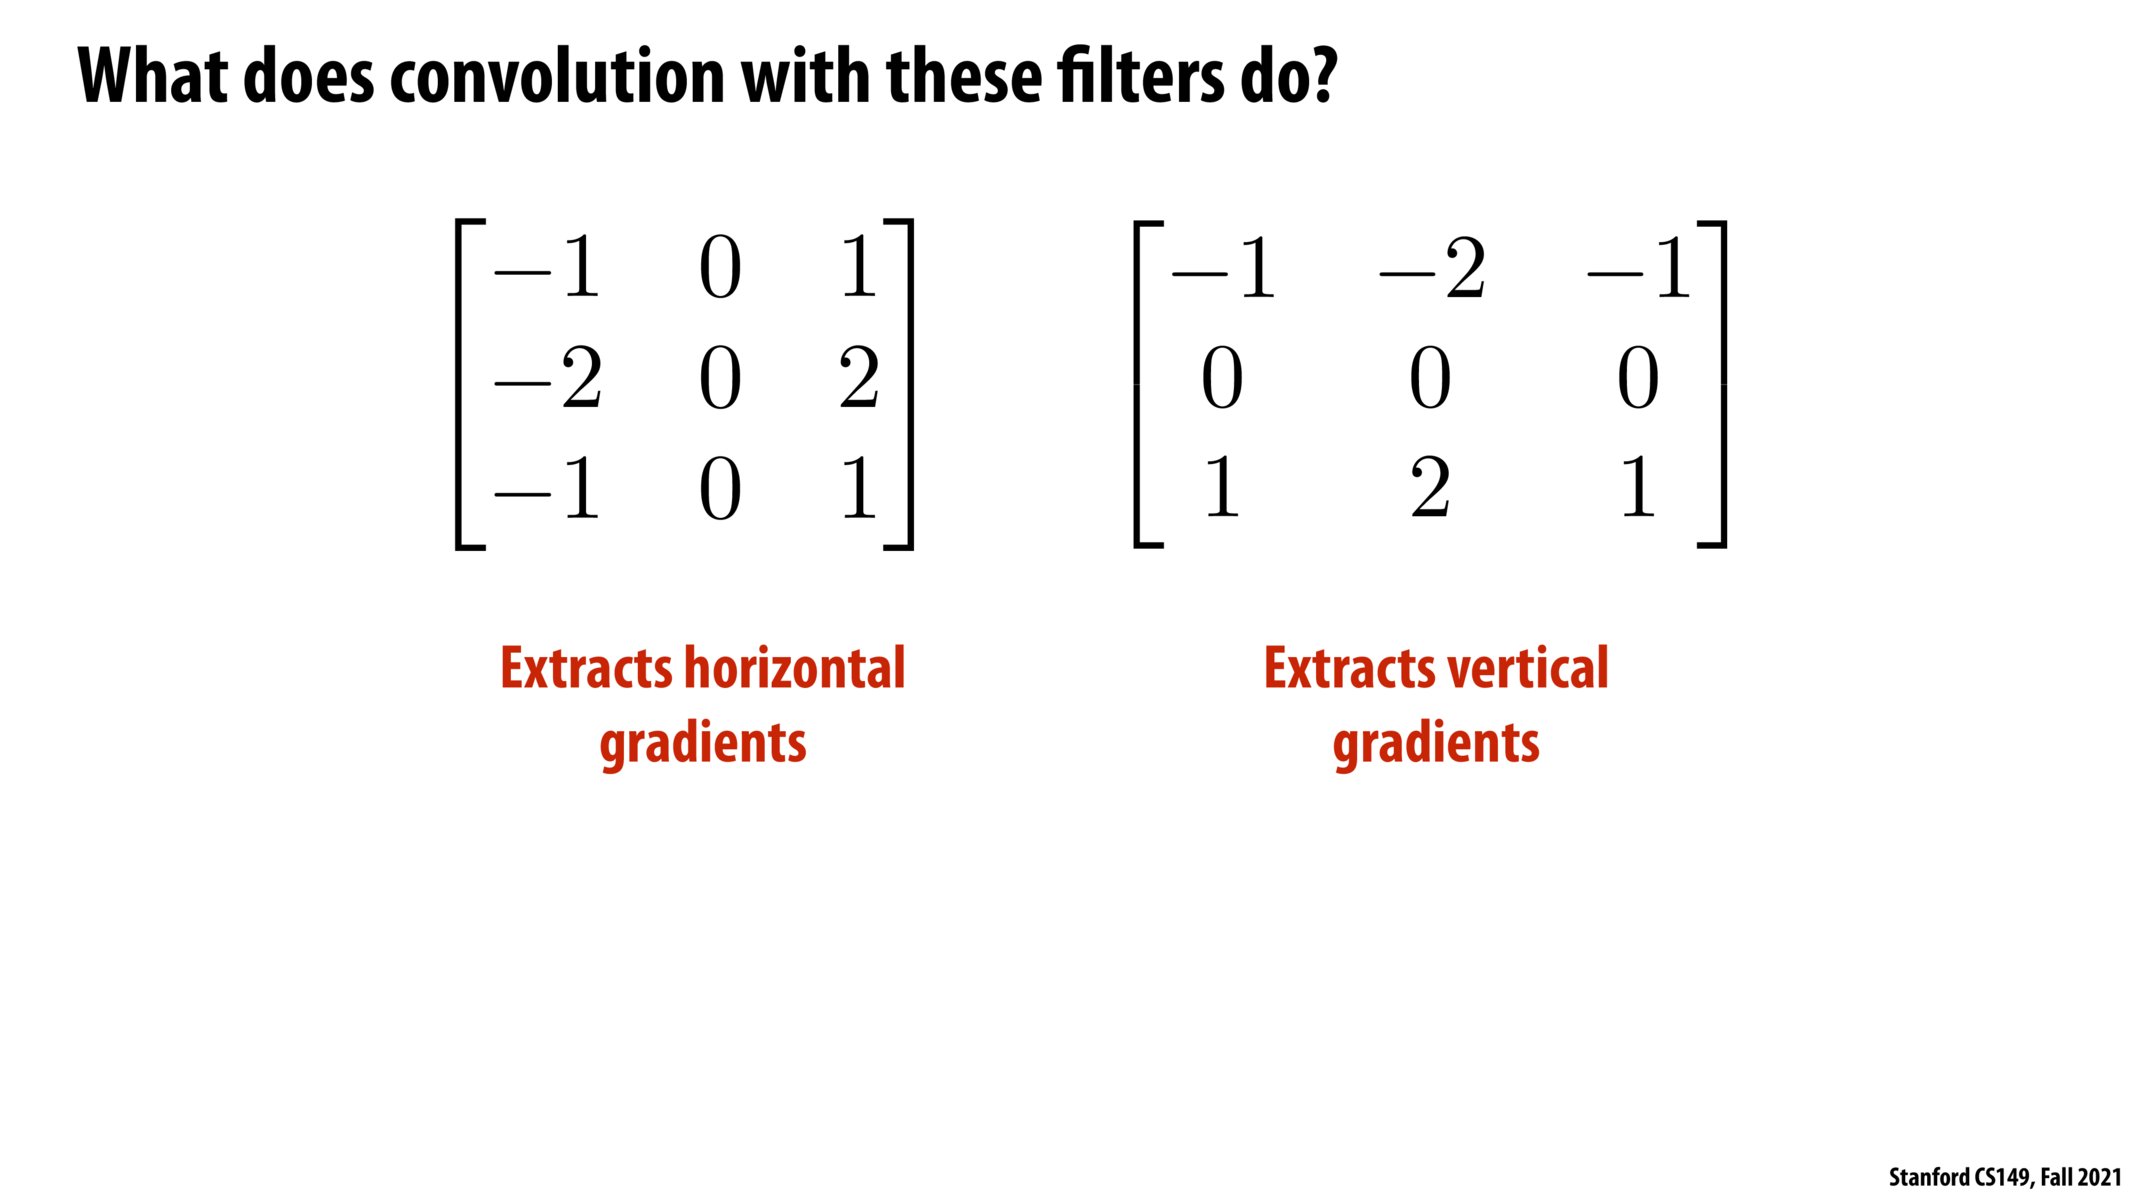


The filters in this slide calculate the gradient of the color across columns and rows respectively. If the input image is of the same color, output will just be 0. If the input image has different colors, the output looks like what's shown in the next slide.

I've never taken any ML or DNN courses so I wasn't sure how to interpret this filter. One thing which I wonder is after googling "convolution" I saw that it's a mathematical operation to relate two functions to each other on how they alter the shape of the other. Is that the same thing as what we're doing here? I understand we're using these "filters" to average out the pixels in the 3x3 regions with these weights but I was wondering if "convolution" in CS is just this act of summing over features with different weights or if it involves other mathematical functions? Also I wonder why we decided to give the middle pixel a weight of 2 while the top and bottom ones are 1. Is it to emphasize/brighten the middle pixel?

Can you make an nxn filter that has the same result of extracting horizontal/vertical gradients, where n is not 3?

I don't think I fully understand gradients here. How does this create black rows/columns across the photo? Is there some intuitive explanation for gradients?

@huangda An intuitive explanation for gradients is a derivative of the image in a specific direction. So if you have a steep change in image value, you expect to have a gradient with a large magnitude (very positive or very negative) whereas if there is a more consistent image value you have a close to 0 gradient.
Imagine you have an image like
20 20 20
20 20 20
20 20 20
Then the result of the "flattened" dot product with the left filter is -20 - 40 - 20 + 0 + 0 + 0 + 20 + 40 + 20 = 0.
But if you have
10 15 20
10 15 20
10 15 20
Then the result of the "flattened" dot product with the left filter is -10 - 20 - 10 + 0 + 0 + 0 + 20 + 40 + 20 = 40.
So the black rows/columns are created in places where the image were relatively consistent in value whereas the bright rows/columns are in locations where there is a large gradient. A common example for a large gradient is an edge in the image.
Apologies for formatting
20 20 20
20 20 20
20 20 20
and
10 15 20
10 15 20
10 15 20
@thepurplecow Yes, you can – this would simply result in having a filter size > 3.
Building on @parthiv, an approach that helped me understand what these filters do is pairing up positive and negative values, and thinking of that as a pair of pixels (p1, p2) with p2 - p1. Then contemplating what the difference between pixels in those positions could mean (then comes the derivative interpretation).
Please log in to leave a comment.
I'm taking a class on implementing machine learning algorithms in embedded environments, and I'm amazed at how quickly some of my classmates can determine what convolution with a given filter does. Does anyone have any advice for getting better at determining the result of convolving with a given filter?