Back to Lecture Thumbnails

shivalgo
kayvonf
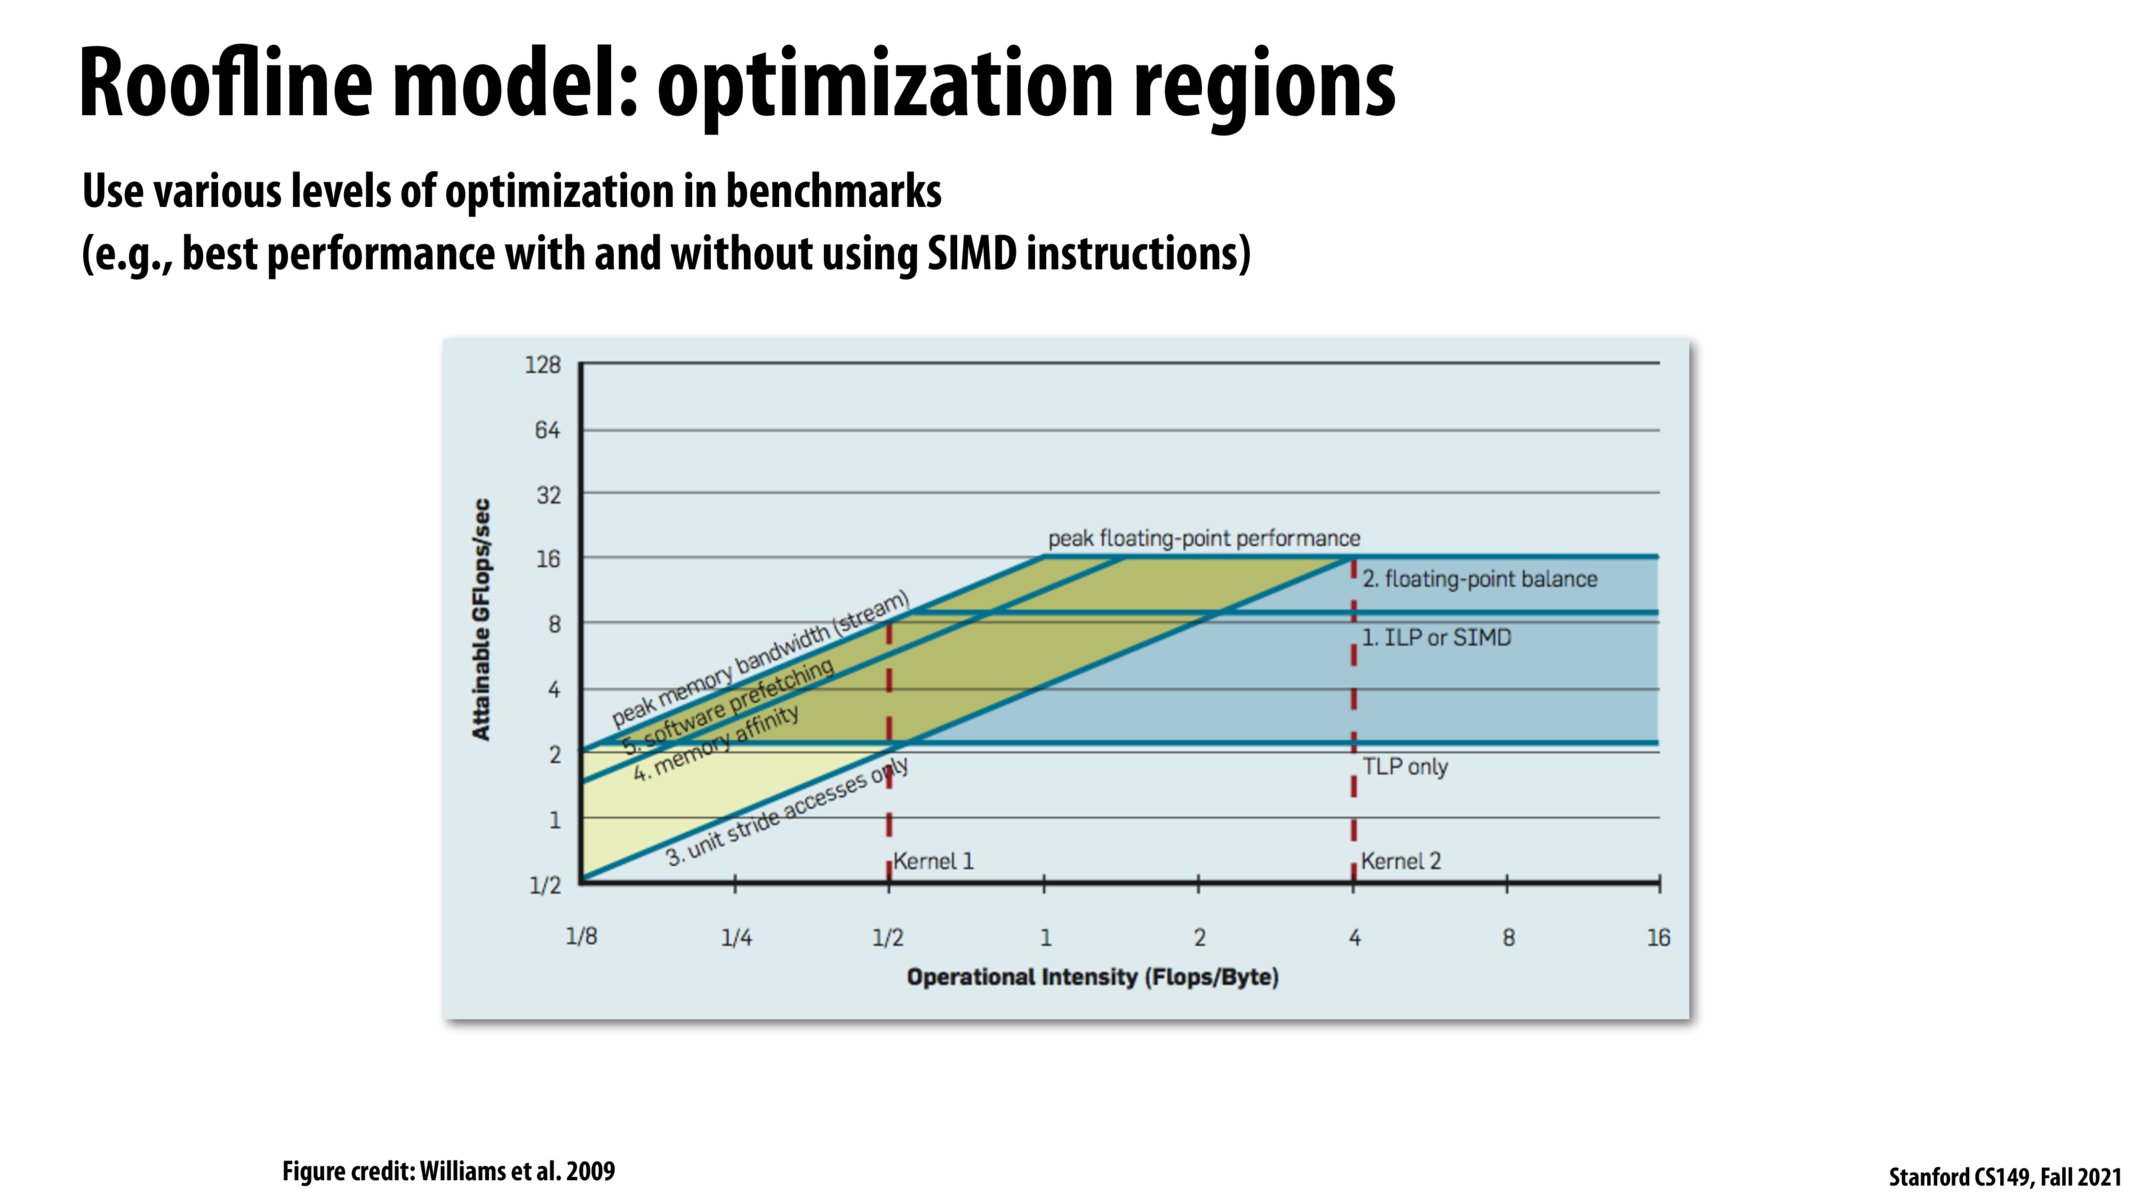
We skipped it do to time, but the point is that different lines on the roofline graph correspond to different computers. For example, if you double the peak instruction throughput of the processor, the Y-value of the flat part of the curve should be twice as high. Why? If you increase the memory bandwidth of the processor, what happens to the slanted part of the curve?
Remember, a roofline plot for a specific processor shows the instruction throughput of a program with a given arithmetic intensity. Moving along the curve is therefore inspecting the throughput of different programs with different arithmetic intensities.
Please log in to leave a comment.
This slide appears to have been skipped. Anything to learn from this?